
Heat waves kill hundreds to thousands of people around the world every summer. Global warming is making it worse. An especially hot summer day today will be a normal summer day in the future. And the rare, deadly heat wave of today will become common. In this post we’ll take a deep dive into the medical aspects of heat illness and the link to climate change.
According to the CDC, heat is the leading cause of weather related death in the US. From 1999 to 2009 heat exposure killed 7,800 people. Not only that, but heat makes chronic medical problems worse, so that more people end up in the emergency department because of the heat.
In this post we’ll examine all things heat and climate change related, including…
- The balance of heat between you and the environment
- How heat makes you sick
- What is a heat wave and how is it measured
- How do heat waves kill lots of people
- The link between heat waves and climate change
- What does the future hold
The Heat and Your Body
The main source of heat is the sun. Solar radiation reflects off the ground, is also absorbed by the ground, then re-radiated back into the air. The balance between the environment and heat retained by your body is shown in the picture and formula below. In summary, a hot environment adds heat to your body, while evaporation of sweat takes heat away.

Body Temperature = Metabolic Energy (M) +/- Radiation (R) +/- Conduction (K) +/- Convection (C) – Evaporation (E)
- Metabolic Energy (M) = your metabolic heat, plus heat from any work or exercise you do
- Radiation (R) = directly from the sun or reflected off the ground
- Conduction (K) = heat added by direct contact with something warmer (+), standing on hot pavement for example
- Convection (C) = movement of air across your body, that usually aids in removal of heat (-), but if the air is warm enough it can add heat (-) (like a convection oven!)
- Evaporation (E) = water evaporating off your skin pulls energy out of your body (-). Note that evaporate only extracts energy (you don’t sweat when you are cold)
Evaporation of sweat is the second most effective way your body cools itself (the most effective way to cool yourself is by behavior, or the things you do to keep yourself cool).
Your body wants to run at an even temperature, not too hot, not too cold, usually around 37C / 98F. The part of your brain called the hypothalamus monitors your body temperature, and when it gets too hot, it sends a signal to your sweat glands to start sweating.
As your skin sweats, the sweat evaporates off your body. When the sweat on your skin evaporates, it requires energy to change from a liquid into a vapor. The energy that drives that change is the heat from your body. Thus energy is taken out of your body and you are cooled.
The figure below is a great conceptual drawing that shows the combined effect of evaporation and convection. Heat is taken out of your body by evaporation, and a breeze, further enhancing your cooling by convection, carries the warm vapor away.

When it’s very hot outside, or very humid, or you are working hard, or you can’t sweat for some reason, then evaporation is less effective and your body temperature starts to rise. This eventually leads to hyperthermia and heat illness.
To Much Heat Can Make You Sick
The health effects of heat fall in a range from minor symptoms to life threatening illness. Any of these conditions could potentially be caused by extreme exertion, but they are all made much, much worse by hot, humid weather.
The table below summarizes the range of heat illness. The basic treatment for all of these is rapid cooling by whatever means possible, from cool drinks, to draping with cold wet cloths, to ice packs in key places, to immersion in ice water.

Spectrum of Heat Illness
| Symptoms | Signs | Cause | Treatment | |
| Heat Cramps |
|
|
|
|
| Exercise Associated Collapse |
|
|
|
|
| Heat Exhaustion / Heat Injury |
|
|
|
|
| Heat Stroke |
|
|
|
|
* Core temperature is measured by rectal thermometer. Other methods will read about a degree or more cooler than true temp
Medical information shown in this article is for illustrative purposes only and do not constitute specific medical advice to the reader. Please ask your doctor or other health professional if you have further questions.

The different methods used to quickly cool a person suffering from heat illness, include…
- Stopping all physical activity and resting
- Siting or laying in the shade
- Drinking cold, diluted sports drink (no alcohol!)
- Cold water spray and fans
- Draping them in cold, water-soaked towels and sheets
- Putting ice packs on the neck, arm pits and groin
- Immersing in cold water or ice water
(Immersion requires at least two people to monitor the victim, one to keep them from going underwater should they lose consciousness, and the other to check vital signs and do other tasks)

If the heat illness is serious, then you should call for an ambulance while you are cooling them down. If you are in a remote area or are unable to get an ambulance for whatever reason, stop cooling when they start shivering, or after about 15 – 20 minutes of aggressive cooling. Ideally you would stop cooling them when their rectal temperature drops to 38C / 101F.
Some important points to remember about heat illness…
- You can’t always tell how bad it is just by looking at someone
- Call for an ambulance early or take them to the hospital if you are concerned
- The longer a person’s core temperature is elevated, the worse the outcome
- Only rectal gives true core temperature. Other methods will read 0.5-1C / 1 or 2F lower than the actual temperature
- Rapid cooling is the cornerstone of treatment
Risk Factors for Heat Illness
Many people have an increased risk for heat illness. And even those persons who are very healthy can also succumb to heat illness. We can divide the risk factors into four categories: 1) risks to even the most healthy, 2) risk factors you are born with, 3) risks due to health problems, and 4) social/demographic risks.
Risks to Healthy People
Strenuous work or exercise outside during hot weather can lead to heat stress. High outside temperatures combined with increased metabolic heat from exertion can raise your temperature to dangerous levels, especially if the humidity is high. If you are not keeping hydrated while exercising or working in the heat, you will make matters much worse.
Another important factor is acclimatization or heat adaptation. Early in the summer, or if you travel to a hot place from a cooler place, you will not be used to working or exercising in hot weather. This makes your risk of heat illness a lot higher than it might otherwise be. More on adaptation in the next section.
Risks You Are Born With

Some risk factors you are born with can increase your risk of heat illness. If you are of Northern European descent you have a higher risk of heat illness. Females have a higher risk too because they have fewer sweat glands than males.
Persons born with genetic defects in their sweat glands have higher risk, as do persons with malignant hyperthermia or sickle cell disease. Interestingly, the place you were born can affect your susceptibility to heat illness. Persons born in cooler Northern areas have increased risk, when compared to their Southern born compatriots.
Risks Due to Health Problems
There are also many risk factors for heat illness that are acquired throughout your life. Chronic disease such as hypertension, diabetes or lung disease increase your susceptibility because you are less able to respond to physical stress.
Medications can increase your risk of heat illness. Some drugs that increase risk, include: diuretics, anti-epileptics, antihistamines, decongestants, stimulants, beta-blockers, anti-depressants, and other drugs.
People with psychiatric problems are at risk too, especially if they take medicines that interfere with their body’s natural response to heat. And of course, alcohol and recreational drugs can dehydrate you, impair your judgment and increase your risk of heat illness and death.
Ongoing infection or history of major burns with scaring (damaged sweat glands) can also increase your risk. If you are obese you risk is increased because you have lower overall fitness, and fat also makes you retain heat (although that might be a benefit during climate change caused epic winter storms!).
Sociodemographic Risks

Some other groups at risk are infants, the elderly, people who live alone, people who work outside, and the poor. Infants are at risk because they cannot sweat and shed heat as well as older children or adults, and they can not act to cool themselves.
The elderly have a lower thirst drive, drink less water, sweat less, and have a lower reserve capacity to adapt to heat. Also, many elderly persons live alone and are on a fixed income, putting them at even greater risk.
The poor are at risk because they may not have access to basic resources such decent housing or medical care. They may not have A/C or if they do, may not be able to afford to run it.
People who work outside, or work inside with limited cooling, are also at risk because they have less control over their heat exposure; they often have to work no matter how hot it is. This can be a problem at the start of summer, before workers are acclimated, or during heat waves.
[The information on risks shown here comes from UpToDate.com and other sources. O’Conner, et al., Exertional heat illness in adolescents and adults: Epidemiology, thermoregulation, risk factors and diagnosis, in UpToDate.com, last updated 31 Aug 2015.]
How does your body adapt to heat?
Acclimation can occur faster or slower depending on the balance of risk factors discussed above. Generally, fit and healthy persons will adapt faster to heat, while persons with chronic disease or other adverse characteristics will take longer. Heat adaptation occurs rapidly during the first 2 weeks that you are exposed to heat.
Your body adapts by subtle changes that allow you to withstand higher temperatures. Over time the plasma volume in your blood increases, and you can sweat more. Your heart rate slows, you use less oxygen, and you lose fewer electrolytes in your sweat. Your core and skin temperature also drop slightly when you are better adapted.
These factors allow you to have increased endurance and work harder under the same environmental conditions than before you were acclimated. However, acclimation can be lost in as quickly as 3 weeks.
What is a ‘heat wave’ and how is it measured?
There is no standard definition for what makes a heat wave. Usually the definition is different from study to study, and deals with various combinations of daily high temperature, minimum nighttime temperature, number of days and other factors. But one thing is clear though, a heat wave is like pornography, you know it when you see it.
It is important to note that when studying large populations, it’s sometimes hard to tell exactly why particular individuals died. In most developed countries death certificates list the immediate cause of death. So if an elderly person died of a heart attack because they were weak and dehydrated, heart attack get’s recorded on the death certificate. Never mind that it happened during an oppressive heat wave and the person lived alone on a limited budget and they couldn’t afford to run their A/C. What this means is that the true numbers of persons that die from heat is probably much higher.
Humidity Makes Heat Waves Worse
Humidity is a critical part of heat exposure. Increasingly humid air keeps that sweat from evaporating off your skin very well. And for every 1 degree centigrade increase in temperature, the air holds 7% more moisture. So we need a good way to figure the impact of humidity on temperature. Fortunately, just such a measure exists.
The common measure of the combined effects of temperature and humidity is called the “Wet Bulb Globe Temperature” or “WBGT” for short. The WBGT was developed by the US military to provide a common measure of the risks of heat illness during training, and is now widely used by different organizations and countries around the world.
The WBGT is defined as…
WBGT = 0.7 (Temp wet bulb) + 0.2 (Temp black globe) + 0.1 (Temp dry bulb)
The important thing to note from this formula is the wet bulb temperature, a measure of the relative humidity, carries the most weight (0.7 versus 0.2 or 0.1). Measurement of the WBGT used to require special apparatus to get the different temperatures. However, most WBGT thermometers these days are handheld, computerized devices that only require a single measurement (picture at right).
A WBGT of 35C/95F is the line that divides life from death. When the WBGT is above 35C then your body can no longer shed heat into the environment – causing you to keep any heat your body makes, and your core temperature to rise. A healthy person can function for about 6 hours under a WBGT of 35C until they get heat stroke. Climate change may cause the summertime WBGT to rise above 35C in some equatorial countries within the lifetime of some of the people reading this blog. More on that below.
Heat Waves Kill
We’ve learned how heat can affect the individual, but how does it play out in large populations? In 2003, Europe had a heat wave of epic proportions. France was especially hard hit. This heat wave began in early July and lasted two weeks. It was the hottest summer in over 300 years.
By the time it was over 14,957 persons had died from heat or heat related causes. The people that died typically had one or more risk factors that we learned about above, including: being older, female, having a chronic illness, living in the city, or being poor. They died of dehydration, heat stroke, chronic disease or infections made worse by the heat. The chart below tells the tale of the death of those people.

* Poumadere, et al., (2005), The 2003 Heat Wave in France: Dangerous Climate Change Here and Now, Risk Analysis, 25(6):1483-1494.
France, like many countries, had no national public policy about how to deal with heat waves. The city of Paris, France, had no preparation or planning for the heat wave and ended up with 150% excess deaths above the usual number of deaths for that time of year. In the city of Marseilles, France, the director of public health at the Marseilles University Hospital held a press conference at a public town hall covering different protective measures for different groups of people. The result? Marseilles had only 25% excess deaths above the norm.
There was huge political fallout in France from this heat wave, many figurative heads rolled, and a national heat plan was put into effect. Just in time too… another massive heat wave hit France in 2006. Keep reading to find out how that turned out.
The Past Ten Years of Heat Death in the U.S.
Next are some graphs that summarize 11 years of heat deaths in the United States from the CDC. The following graph shows that persons living in cities (metro) and in rural areas (non-core) are more affected by heat. Also, persons living in the Southern and Western US are also at greater risk. The “large fringe metro” areas have lower death rates, likely because this represents suburban areas or areas of higher income.

Half of the world’s population lives in cities. City dwellers are at increased risk due to the heat island effect, and interaction of heat and pollution. Also, many cities lack open green spaces that help to keep temperatures down.
The heat island effect is caused by all the concrete and steel soaking up the heat of the day, keeping it relatively high, and radiating back into the air at night causing higher nighttime temperatures. The nighttime is when people recover from the days heat. If it’s warm at night, people cannot recover as well.
Lastly, extreme heat plus car exhaust makes lots of ozone. Due to all the cars, trucks, and industrial activity in cities, a lot of ground level ozone is created. People with heart or lung disease are especially hard hit by ground-level ozone, which can push them over the edge, exacerbating their disease and sending them to the emergency room. Pretty much anyone with a chronic disease is at increased risk from ozone. This blog did an extensive post on the effects of ozone and climate change.
What’s the link between climate change and heat waves?
Climate change has already had an impact on the number and intensity of heat waves. What that means is that people are already suffering and dying from heat waves made worse by climate change.
A recent study titled Anthropogenic contribution to global occurrence of heavy-precipitation and high-temperature extremes, by E.M. Fischer and R. Knutti, in the journal Nature Climate Change,tried to determine the impact of global warming on the frequency and intensity of extreme precipitation and heat waves. Extreme precipitation and flooding was discussed in an earlier blog post.
The study compared the results of 25 different climate models to see what the climate would have been like if we had never burned any fossil fuels. They then compared that to real events caused by the current increase in global temperature (0.85° C / 1.53° F) that has occurred since the beginning of The Industrial Revolution. The 25 models were also run into the future to see what happens if the temperature goes up by 2° C / 3.6° F and beyond.
They found that for global warming that’s already happened (0.85°C / 1.53°F) — 75% of the most extreme heat events are caused by global warming. For the 2°C / 3.6°F of warming that is likely to happen — there will be an exponential increase in extreme heat events.
Part of a key graph from that paper is seen below (the heat part). What this graph shows is that as the temperature rises, more extreme events will happen, and more of the extreme heat waves will be due to the burning of fossil fuels.
What’s more, this graph also shows that we are already having a major impact on extremes (the orange line on the left), which means people are getting sick and dying today from heat waves made worse by human-caused climate change. The red line on the right shows where we will be when we hit the 2C goal or limit to global warming in 2050. It doesn’t look like a place any of us would want to be.

More about the Fraction of Attributable Risk (FAR)
The bottom graph is the fraction of those extreme events that are caused by us humans – the fraction of attributable risk (FAR). The FAR can be described as: all events that actually happen, minus the probability of an event not happening divided by the probability of it happening under a certain set of conditions.
The “not happening number” of the FAR was determined by running the climate models without any CO2 from human activity since the industrial age. The “events happening” number is determined by running the climate models with all the CO2 that humans have ever added to the atmosphere. So, the ONLY thing that differs from the two sets of model runs is the input of human-produced CO2.
What does the future hold?
A study done in 2015 by scientists at the City University of New York and at the National Center for Atmospheric Research attempted to project future trends in heat exposure in the US.
This work combined two trends, the expected increase in temperature using 11 climate models, and the expected change in the distribution of US population by 2070 due to internal migration. They merged these data sets to get the number of people that will be exposed to extremes of heat as the climate changes. They defined extreme heat as a daytime max temperature of >35C / >95F.
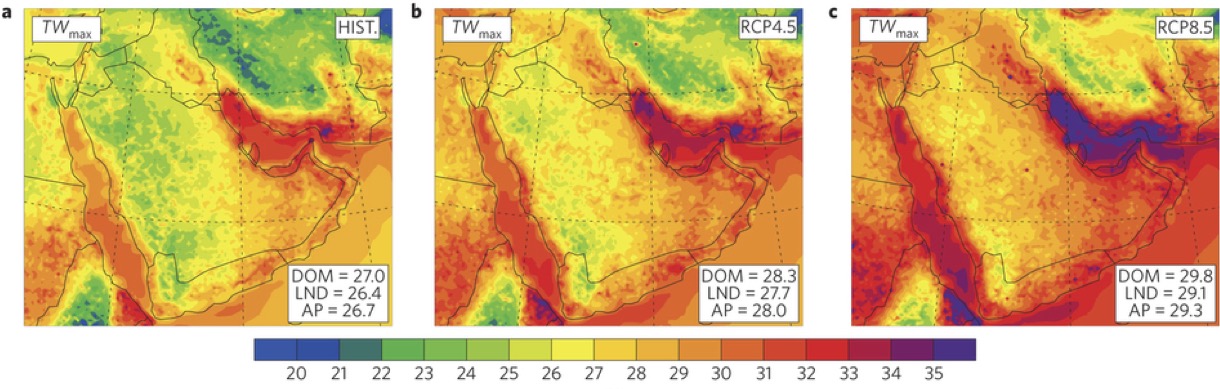
The figure below from that study tells it all. The map in the upper left is the change in population (a), the upper right shows the change in heat extremes (b), and the one at the bottom is the combination of the two upper maps that shows how many more days people will be exposed to worsening extreme heat (c).

Jones, et al, Future population exposure to US heat extremes, Nature Climate Change, 2015, 5:652-656.
Another figure from that paper is shown below, and gives the change in heat exposure from the base period of 1971 to 2000, compared with the study period from 2041 to 2070. From this figure you can see that the West South Central (TX, OK, LA, AR) and the South Atlantic (FL, GA, SC, NC, VA, WV, MD, DE) census divisions will have some of the highest exposures. How does your state fare?

*Click to see a map of US census divisions
This is a fairly unique paper in that it considered the distribution of population to determine those at risk (in that respect they are taking a cue from public health – something more climate change researchers are doing). It does have a few shortcomings. As the authors state, their study just says how many are exposed, they did not account for the health and economic risks that drive bad outcomes. Also, they did not figure the impact of humidity.
One thing that might lessen the impact is a reverse in the decades old trend of migration from north to south in the US. As the climate heats up people will begin to migrate north to escape the heat and drought. (Here’s a great book about that, that I highly recommend “The World in 2050: Four Forces Shaping Civilization’s Northern Future“.)
The Worst Case Scenario
Extreme heat combined with the humid air can raise the temperature to the point where human beings can no survive outside. As discussed above, a wet bulb globe temperature of 35 C / 95 F or higher is uninhabitable. In essence, the air is so warm and moist that your body cannot shed heat into the environment anymore. When that happens you keep all your heat, your body’s core temperature rises, and you get heat stroke and die.
The Earth’s climate is pretty remarkable in that during all of human evolution over the past few million years the WBGT has not risen above 35C at any place on the planet. That’s about to change.
In a really understated bit of work*, two MIT scientists used a collection of climate models to predict the impacts of climate change in the Persian Gulf – a place that can be both very hot AND very humid. What they found is that along large swaths of the Persian Gulf the WBGT will rise above 35C, and will thus be uninhabitable by humans during the summer, sometime between 2070 – 2100 AD.
*Pal & Eltahir, Future temperature in southwest Asia projected to exceed threshold for human adaptability, Nature Climate Change, 2015, 6:197-200.
If all that sounds farfetched to you, consider that for the first time in recorded history this came very close to happening in 2015. On the 31st of July 2015 at Bandar Mahshahr Airport, Iran, the temperature was above 40C / 104F, the humidity was ~49% and the WBGT peaked at 34.6C / 94.3F. In terms of WBGT, this was the worst heat wave ever recorded.

*Map from… Christopher Schar, Climate Extremes: The worst heat waves yet to come, Nature Climate Change, 2016, 6:128-129.
There are many threats from climate change, but heat is probably the biggest threat that will impact people around the world. These effects will not be confined to the Middle East, many areas along the tropical belt and equator will also be affected. Not to mention that the health impacts will still be pretty bad in even the more temperate areas where people are not used to extreme heat.
So what happened during the French heat wave of 2006??
After the huge number of deaths following the 2003 heat wave in France, a national heat plan was created. The plan included finding out where all the vulnerable people were, real time surveillance of illness and death during heat waves, installing additional A/C equipment in hospitals and nursing homes, setting up an early warning system, and creating emergency plans to enact during heat waves.
Come mid-July of 2006 the temperature crept up to reach daytime highs of 35C / 95F. This was the second hottest heat wave in recent French history (2003 was the hottest). The graph below tells another tale — a tale of adaptation.
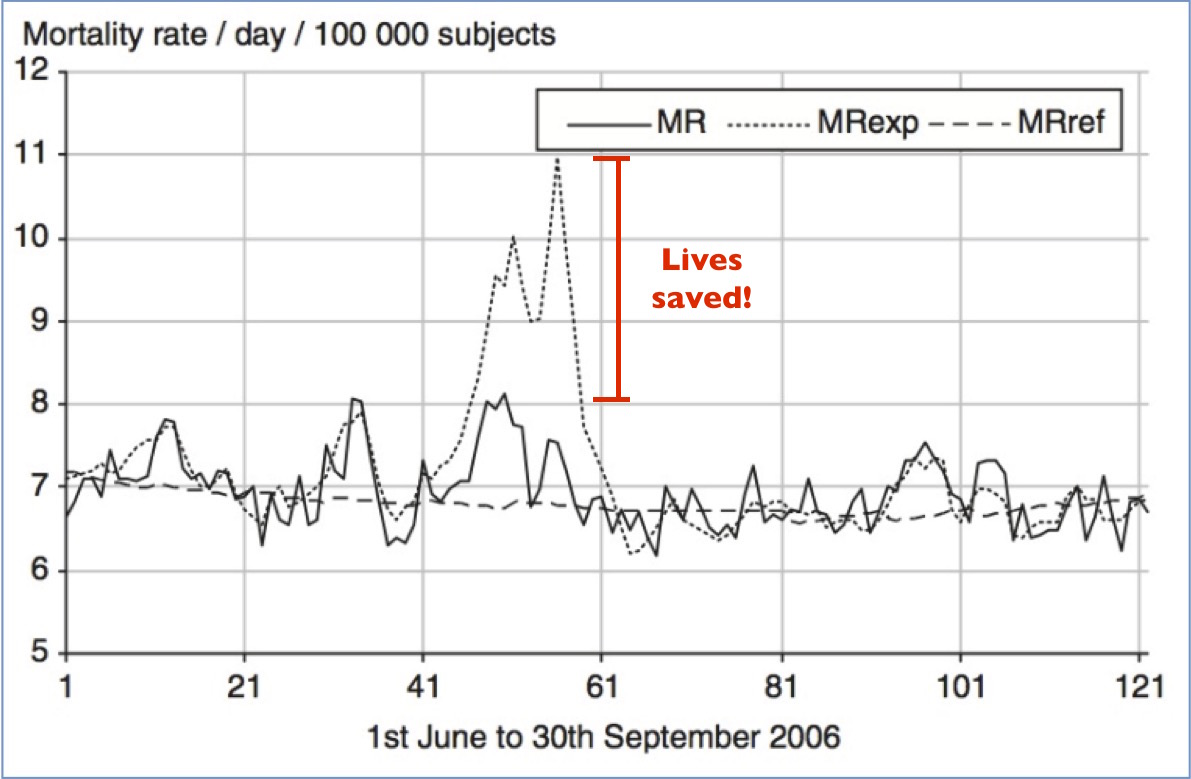
The expected number of deaths due to the heat wave should have been an additional 7,181, but only 2,087 additional deaths were seen. This represents 5,094 people that were saved by the public health measures put into effect by France’s national heat plan.
*Fouillet, et al. (2008), Has the impact of heat waves on mortality changed in France since the European heat wave of 2003? A study of the 2006 heat wave, Intl J Epi, 37:309-317.
Protecting Ourselves from Extreme Heat
What France’s experience shows is that adaptive measure can work for large populations. Government action is important to protect society as a whole, and to protect those who are more vulnerable. But society’s preparedness also rests on the individual — on you. There is plenty you can do to protect yourself and your family.
Protecting yourself from extreme heat can take many forms, from changing your behavior during heat waves, to stocking up on things that help you get by, to a temporary or permanent move. The measures you take will differ depending on your personal risk factors and your available resources.
In the next post we take a close look at how we can protect ourselves and our loved ones from extreme heat made worse by climate change. So please stay tuned…
Sign up for email notification when The Climate Advisor posts new articles, and get your free TCA Disaster Prep Checklist, a gazillion dollar value, free! 🙂